To Manage It, Measure It
Featured Article by: Larry F. Johnston, PhD
Seasoned managers know the Principle of Inspection intimately: “You get what you inspect, not what you expect.” A close companion principle for managers, The Measurement Principle, states “What gets measured gets done.”
Although these principles are embraced without question in the for profit world, nonprofit organizations have been slower to understand their criticality when it comes to effective performance management. There are many reasons why this is the case, but I suspect that several key reasons top the list.
First, many (most?) nonprofits and charities were founded by people motivated primarily by philanthropy and for religious or humanitarian reasons. Their goals have been the improvement of life as we know it, whether at the level of individual, family, neighborhood, community, nation, or the world. Because organizations are often the “lengthened shadows” of their founders, the cultures of these organizations were understandably shaped in fundamental and powerful ways by the values of these founders. Unlike their counterparts in the business world, where the pursuit of profit and return on capital led to operational and financial processes demanding advanced quantitative analytical techniques, founders of nonprofits have pursued goals that were seen and felt to be largely qualitative.
Second, because nonprofits have historically attracted staff who differed in significant ways in their values and education from their commercially oriented counterparts (for example, I’ve never met anyone who went to work for a nonprofit as part of a ‘get rich quick’ scheme!), a great many nonprofits have been staffed by those educated in the humanities where quantification and quantitative analysis were not the priorities they are in business and the sciences.
Third, for many decades most donors were content to rely more on the impression that nonprofits were doing a good work than they did on hard facts demonstrating results. Heartwarming stories were more important than lifeless and abstract statistics. Not surprisingly, the absence in decades past of today’s intense competition among nonprofits made inter-organizational comparisons of productivity, impact, and cost-effectiveness secondary concerns at best.
As stakeholders, donors were figuratively buying “shares” in the organization’s ability to produce life-changing, community-changing, or world-changing results, but relatively few would have viewed their gifts through the cold, rational-analytical lens of “return-on-investment.”
In recent years, however, a quiet donor revolution was triggered in the turbulent wake of the customer revolution, and new donor perceptions and expectations are in many cases changing the demands donors are making upon nonprofits. This, in turn, is raising the
bar in terms of expectations regarding nonprofit performance and reporting to stakeholders, and, consequently, the importance of metrics.
Five Ms
In this article, we’ll take a brief look at “5 Ms” as they impact nonprofit management and management’s ability to persuade increasingly skeptical donors that gifts to your organization are sound investments:
- Does measurement really matter?
- What should you measure?
- How should you monitor these measures?
- How do you use measures to motivate?
- What’s the message?
Does Measurement Really Matter?
MEASUREMENT-MANAGED COMPANIES EXHIBIT DIFFERENT CULTURES
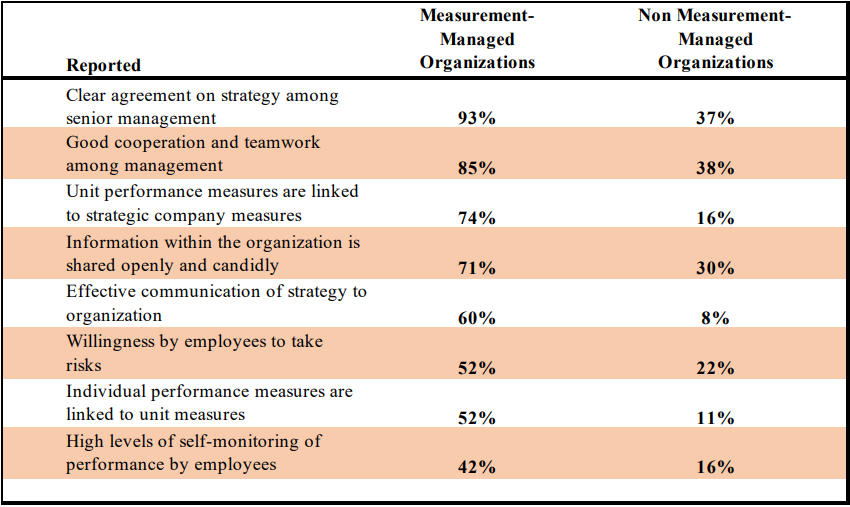
John H. Lingle and William A Schiemann, “Is Measurement Worth It?,” Management Review, March 1996, pp. 56-61. From Bulls eye! Hitting Your Strategic Targets Through High-Impact Measurement, William A. Schiemann and John H. Lingle, p. 12.
For those already persuaded that measurement matters, you’ll be pleased to know that the jury has indeed returned with its verdict on the importance of metrics. In their book Bullseye! Hitting Your Strategic Targets Through High-Impact Measurement, William Schiemann and John Lingle document the differences that measurement makes in organizations. A few moments spent reviewing the substantial – and in some cases dramatic — differences that measurement makes should persuade even skeptics and naysayers of the benefits of sound metrics. But if we concede that measurement really does matter, exactly what should we measure?
Measuring the Critical Few
Conceptually, organizations have measures that fall within four categories reflecting the “lens” of general systems theory: inputs, throughputs, outputs, and outcomes.
- Inputs are generally measures of resources allocated and efforts undertaken. That is, how much time, talent, effort, or budget went into a particular program, project, event, or activity.
- Throughputs are often measures of efficiency that deal with things like cycle times. For example, how long does it take to turn around receipts and thank you letters once a gift is received? Clearly, a start-to-finish receipt/thank you cycle time of 24 hours is much more attractive than a week.
- Outputs are measures of productivity. For an organization distributing medicine to fight River Blindness, for example, the number of Mectizan tablets distributed to villagers would be an output.
- Outcomes, on the other hand, might be the number of people treated and cured who were spared the ravages of this horrific disease. Outcomes speak to the end results that program staff and donors alike are seeking. For example, a community development specialist might have conducted 24 training workshops in Africa or Latin America (outputs), but how were the knowledge and skills of workshop participants actually enhanced and what impact did participants subsequently have in their work as a consequence (outcomes).
A prudent rule of thumb on metrics is to apply the Principle of the Critical Few or the “80/20” principle. This principle suggests that 20% of your measures will yield 80% of the desired insights, with another 80% yielding only 20% of the data or insight needed for action.
Savvy organizations will apply this principle by first identifying the Key Result Areas (KRAs) most important to the organization’s mission and vision, something generally done as part of the strategic planning process. In short, of all the things the organization could do, what 20% of potential actions would likely yield 80% of the desired results? Generally, these are no more than four to seven areas for all but very large organizations (more than seven raises a real question as to how key these areas really are).
How do you know if your KRAs are really key? Once they’ve been identified, you’ll know they’re truly key if:
- Succeed in these areas and failure elsewhere will likely not matter.
- Fail in these areas, and no amount of success in other areas will ultimately matter.
Once identified, the organization should then proceed to identify the Key Performance Indicators (KPIs) within each of these KRAs. At the corporate level (measures will increase in number at the divisional or departmental level as they cascade through the organization), most organizations should have no more than 20 to 30 measures that are truly key to determining how well the organization is performing.
By way of example, most nonprofits today would rightly say that the area of donor development or fundraising is a Key Result Area. Within this KRA, measures like total gift income, net income, ROI (return-on-investment), total number of active donors, number of
new donors, donor retention rates, and average annual giving would be key performance indicators.
——– § ——–
“If something exists, it exists in some amount.
And if it exists in some amount, it can be measured.”
——– § ——–
At this point several relevant sidebars may be in order.
First, there are some who, due either to aversion to accountability or simply to naïveté, like to claim that what they do really can’t be measured. Often to their discomfort, I respond with the Principle of Quantification which states, “If something exists, it exists in some amount. And if it exists in some amount, it can be measured.”
Admittedly, the mere fact that it can be measured doesn’t mean it should be measured, that it’s important to measure it, that it’s cost-effective to capture the data, etc. But I encourage a healthy skepticism regarding any claims that something can’t be measured.
Second, strive to measure what you want (i.e., those measures that are really important), rather than resigning to want what you can currently measure. That is, don’t be like the proverbial drunk searching for his car keys under the lamp post. Although he lost his
keys on the other side of the street, he continues to look under the lamp post because the light is better there!
Third, strive to heed Albert Einstein’s admonition to “Make things as simple as possible, but no simpler.” That is, pursue a minimalism in your measures that reflects a “less is more” posture. The fewer measures you have without leaving truly key measures out, the better off you’ll be. Because your real goal in all measures is to achieve and sustain a strategic focus on what matters most, the more you clutter the dashboard or scorecard with less important measures, the more the entire exercise becomes self-defeating.
Monitoring
“Measurement is the first step that leads to control and eventually to improvement. If you can’t measure something, you
can’t understand it. If you can’t understand it, you can’t control it. If you can’t control it, you can’t improve it.”
— H. James Harrington, Business Process Improvement
Once you’ve identified your Key Result Areas (KRAs) and Key Performance Indicators (KPIs), it’s time to revisit the guiding premise that “What gets measured gets done.” Let’s quickly note, however, that the statement “What gets measured gets done” is only true in certain organizations.
———— § ————
“What gets measured gets done”
is only true in certain organizations.
———— § ————
Which organizations? Those where there are clear consequences like recognition and rewards for solid performance and penalties for consistently poor performance. Even without these important consequences, however, you can generally rest assured that what gets measured at least gets attention.¹
Charts and Graphs
Because a picture is still worth a thousand words², I encourage clients to track performance on key performance indicators with colorful charts and graphs rather than merely tables of data that tax the interest, analytical capacity, and attention span of many readers. Because everyone is familiar with traffic lights, colors can be used creatively on reports, charts, and graphs to indicate status:
- Green: on target; in good shape.
- Yellow: off target; in need of attention.
- Red: Significantly off target; in need of immediate attention.
On most measures, I’m an advocate of retrospective (historical) and prospective (against goals, objectives, or improvement targets) charts and graphs. That is, if I’m interested in donor retention rates as a key performance indicator, I’ll want to see a chart that shows what my donor retention goal was for a particular period, let’s say year-to-date, what my actual retention rate was year-to-date, and what my retention rate was year-to-date last year. This way, I can see in a quick glance not only how I’m doing relative to last year during the same period, but also how I’m doing relative to goals I’ve set that should be driving improved performance on these indicators.
Motivation
One of the positive and powerful things about the right kind of goals is that they have the ability to focus personal and organizational energy and resources on productivity. ³ Although issues of motivation theory and practice can become complex, here are some basics:
1. If I believe my work is important (e.g., to those served by my organization, to me, to my family, my peers) and;
2. I know my performance on certain key indicators is being evaluated monthly4 and;
3. there are recognition and rewards for positive performance and penalties for consistent sub-par performance, then,
4. improved performance is likely.5
We could summarize this in a formula: I x E x R = IP, where I = belief in the importance of the work, E = measurement-based evaluation, R = recognition and rewards, and IP = improved performance.
To operationalize this simple concept, I’m an advocate of having reasonably comprehensive “ABC” reports (accuracy, brevity, clarity) regularly distributed to all members of a given team responsible for managing certain programs, projects, processes, etc. in advance of monthly meetings.
For example, if an organization has a development team with different managers or directors for major gifts, foundations, events, direct mail, planned giving, website, alumni, etc., each member of the team gets the “development dashboard” or scorecard reports for the entire department, not just their own areas. Some might consider this a “You can run but you can’t hide” practice, demonstrably therapeutic in organizations genuinely concerned about performance management, especially those with employees inclined to claim that what they do really can’t be measured.
During monthly team meetings6, each team member is expected to comment briefly (e.g., five minutes unless an in-depth report is warranted) on highlights of charts and graphs related to his or her key performance indicators. Because all reports, charts, graphs, etc. should have been distributed to all team members sufficiently in advance of the meeting to allow study and familiarity with all reports, oral reports and comments can be kept very brief. There is no reason for managers to take valuable time to restate what well-designed
charts and graphs have already conveyed, and time for questions and discussion can now focus on action implications of the data, not reiterations of data already evident.
Further, by focusing on “Who needs to do what by when” regarding specific key performance indicators, rather than merely listening to reports of activity — which can often confuse motion with progress — team members can pool their collective experience and expertise to enhance individual and team performance on the indicators that really matter.
What’s the Message?
What’s the “message” in this focus on measures?
First, by integrating strategic measures into an organization’s performance management system, an organization is saying, in effect, “Read my lips: performance matters.” Because numerous studies have revealed that alarmingly high percentages of the activity and processes within organizations do not demonstrably create or add value for stakeholders and thus could legitimately be considered waste, strategic measures repeatedly remind everyone that “The main thing is to keep the main thing the main thing.”
———— § ————
“The main thing is to keep the main thing the main thing.”
———— § ————
Because what gets measured gets attention – and ideally actually gets done – choosing these key performance measures is arguably one of the most strategic things an organization can do. (Keep in mind that because people will tend to do what gets measured, measuring the wrong things will simply get you more of what you don’t want.)
Second, although human interest stories will likely continue to be more important to many stakeholders than statistics (“story” remains one of the most universal and archetypal forms of communication), the right statistics are nevertheless increasingly important. Not only for improved performance and missional impact, but for communications that convey a performance brand to stakeholders: “This is an organization that is getting the job done!”
Stories should in fact animate, humanize, and give life to performance statistics, but reliance on stories alone can actually disguise an organization’s failure to perform (e.g., tell a few dramatic stories of lives changed and hope that donors infer that there are many of these stories when in fact that may not be the case).
In Summary
In this article we’ve looked briefly at “5 Ms” of improved management that relate to organizational metrics:
• Does measurement really matter?
• What should you measure?
• How should you monitor these measures?
• How do you use measures to motivate?
• What’s the message?
Although the right measures alone are no panacea for improved performance, their absence will increasingly raise red flags for serious managers and discriminating donors.
The hoped-for takeaway of this article is captured succinctly in the title:
If you really want to manage it, measure it.
NOTES
- For readers interested in further insights related to consequences, I recommend Jim Collins’ article, “Turning Goals into Results: The Power of Catalytic Mechanisms,” in the Harvard Business Review, product number 3960.
- It could be argued, in fact, that pictures today are worth more words than ever. Our media dominated culture has resulted in the triumph of the visual over the verbal when it comes to persuasion, meaning that today, the right picture (photo, illustration, etc.) might be worth 10,000 words.
- It’s my personal conviction that this is the primary task of organizational leadership and management: to focus energy and resources on productivity.
- If I am truly self-motivated, I’ll be evaluating my performance before my boss or anyone else does. Knowing that others on the team also have access to my performance data eliminates any option of seeking refuge from accountability in obscurity or the performance “data vacuum.” Healthy peer pressure can keep the performance bar high when other forces might simply drive staff towards a “good enough” attitude. Note that this scenario also assumes, to use Jim Collins’ metaphor in Good to Great, that the organization has the right people on the bus, the wrong people off the bus, and the right people in the right seats. No strategic performance management system, great metrics included, is likely to compensate for “mis-fits” — failing to align personal strengths, knowledge, and competencies with the requirements of a given job.
- Our focus here is on one dimension of organizational performance, metrics. If all of these elements are in place and performance fails to improve, the search for causes leads elsewhere. Often, in the context of strategy mapping and Balanced Scorecards, if the components of Information Capital are all in place, the cause(s) of unsatisfactory performance may lie in Human Capital or Organization Capital. Often the issue is the lack of fit between an individual’s or team’s strengths and the type of work required. In other cases, the causes are not internal to the organization, but due to market conditions.
- Although some teams meet or “huddle” weekly, few nonprofits are engaged in activities so time sensitive that they warrant key performance indicator reports weekly at the departmental or corporate level. Quarterly “reviews/previews” provide for more in-depth analysis and discussion, but monthly is a good frequency and schedule for most organizations.
_________
If you’re interested in going beyond strategic planning to building a strategic management system, or just improving your organization’s metrics and performance management, contact Larry Johnston at larry_johnston@mcconkey-johnston.com or call or text him at 303.638.1827 for a complimentary consultation.
Larry Johnston is president of McConkey • Johnston International, a firm serving nonprofits of all sizes in the U.S. and abroad for more than 40 years. www.mcconkey-johnston.com